Measuring Pay Equity: Small Sample Size Group Analysis
When sample size is small (below 30/5-rule threshold, see XXX reference intro), group-level statistical investigations of pay equity should employ methods developed specifically for small samples. One such method that is commonly used is the Test of Median-Split Proportions, which the EEOC refers to as the “Threshold Statistical Test”. The test of median-split proportions for an analysis of gender equity in pay compares the proportion of men and women who are above and below median pay. Gender equity in pay is indicated when men and women are equally represented above the median value, i.e., when the proportions of male and female worker earning above-median pay are equivalent.
An analysis of gender equity in pay using the test of median-split proportions requires the following steps:
Step 1: Identify Employees in Substantially Similar Work Categories
The California Fair Pay Act (FPA) was enacted to ensure that individuals performing “substantially similar work,” when viewed as a composite of skill, effort, and responsibility, are compensated equally. It therefore is most appropriate to test for disparities in pay among individuals who are performing substantially similar work Step-by-Step Job Evaluation Template for Employers to Determine Wage Rate.
Step 2: Compute Median Pay
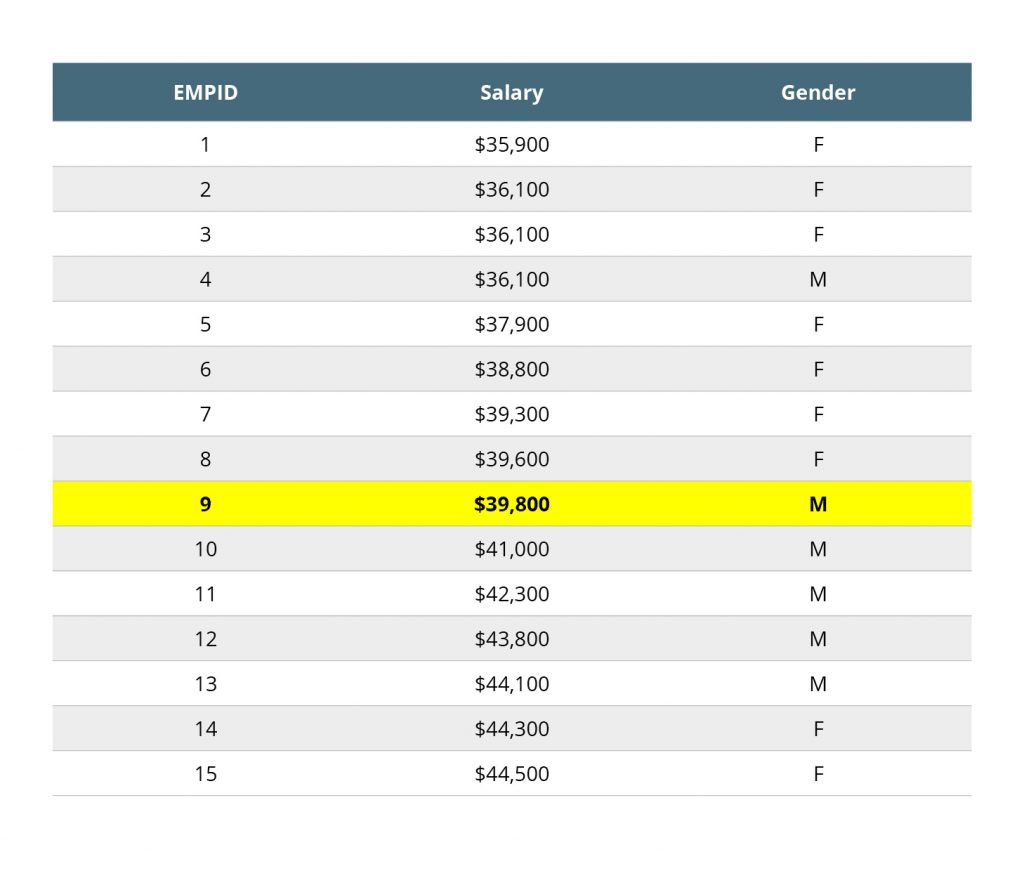
Median pay is the value of the middle case when the cases in the dataset are ordered from the lowest to highest value of the variable measuring pay. Here are the steps to obtain the median pay:
- Order the cases in the dataset from lowest to highest value of the pay/wage variable
- Find the mid-point from this range of wages:
- If there is an odd number of records in the data, the median is the value of the case at the middle of the array.
- If there is an even number of records in the data, then median is the average of the values for the two cases at the middle of the array.
Step 3: Count
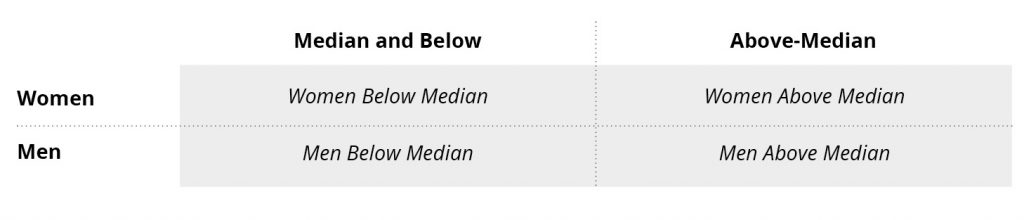
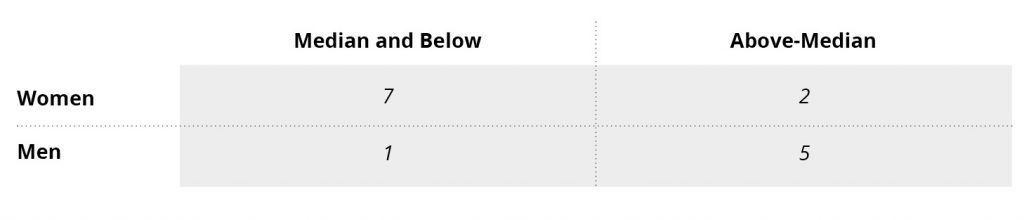
Count the number of men and women above and below the median value. If there is an odd number of records in the dataset, the individual at the median is included in the “median and below” group. Arrange the counts into a 2×2 table.
Figure 1: 2×2 Table of counts of Gender by Median
Step 4: Test for Differences in Representation Above the Median
To test if men and women are equally represented above the median value, statistical methods for testing differences in proportions are used. When the sample size is small, Fisher’s Exact Test is generally accepted as the most appropriate method. When the sample size is sufficiently large, the Chi-Square test of Independence is generally preferred. When these tests indicate that there are significant differences in proportions, it may indicate that there is a gender difference pay.
Example illustrating the Test of Median-Split Proportions:
Step 1:
Step 2:
Step 3:
Step 4:

DISCLAIMER: The materials provided on this web site are for informational purposes only and not for the purpose of providing legal advice. You should contact an attorney to obtain legal advice about any particular issue or problem. The materials do not represent the opinions or conclusions of individual members of the Task Force. The posting of these materials does not create requirements or mandates.