
Measuring Pay Equity: Cohort Analysis
Once potentially underpaid individuals are identified, the next step is to investigate the possible explanations for those differences using a method that is often referred to as a “cohort analysis.” A cohort analysis is largely an exploratory and qualitative investigation for which there is no scripted methodology, but the following tips may be used as a guide:
- Start with the individual pay difference analysis results: Prioritize the investigation by focusing on most severely underpaid individuals first. Individuals with larger negative pay difference are more severely underpaid. Standardized pay difference are very helpful in identifying and rank ordering underpaid individuals.
- Create comparable cohorts: For each underpaid employee, identify others who share similar characteristics (e.g., similar tenure, performance, and all relevant measurable bona fide characteristics). Individuals who share similar attributes may be considered a cohort and all else being equal should be paid similarly.
- Examine employee files of comparable cohort members to identified disparities that may explain the pay differential. A manual review of employee files of comparable cohort members may reveal unique employee experiences that account for pay differentials; they may also reveal systemic disparities that explain both individual and group differentials. Analysts should reference the (XXX available defenses for pay differences) to better understand if the source of pay disparity is in violation of California Fair Pay Act.
Here’s a hypothetical example of a cohort analysis:
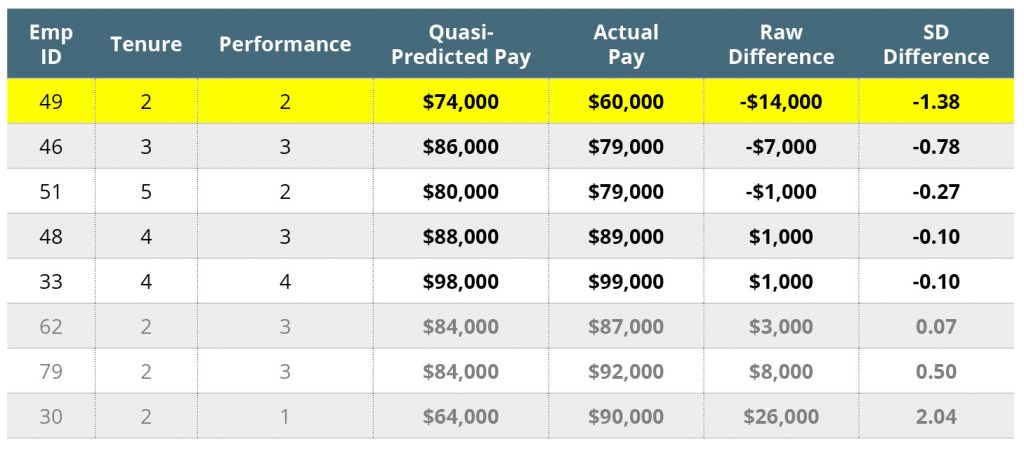
Step 1: Sort order SD Difference to identify most underpaid.
In this example, SD Difference, in the individual pay analysis is sorted. After sorting, Employee ID=49 emerges as the most underpaid by -1.38 SD.
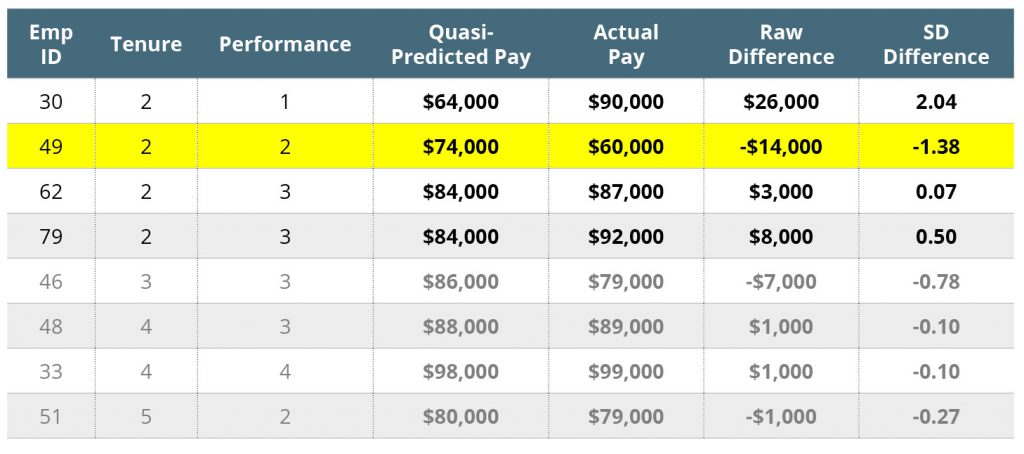
Step 2: Create Comparable Cohorts
In this example, Tenure and Performance is sorted, and a comparable cohort emerges. In this example Employee IDs= 30, 49, 62, and 79 have two-years of tenure and performance that range around 1 to 3. Given the similarity in individual characteristics, the pay should not differ too much. In this example, that is not the case. Comparing Employees 49 to 30, this difference is large. Although Employee-49 has the same tenure (2-years) and higher performance than Employee-30, Employee-49 is very much underpaid (-1.38 SD), while Employee-30 is very much overpaid (2.04 SD).
Step 3: Examine Employee Files
After creating and examining comparable cohorts, it is possible to identify which specific employee files should be pulled and qualitatively examined to determine why, despite similar characteristics, the employees are paid so differently. When employee files do not provide sufficient information, it may be helpful to conduct interviews with supervisors and HR personnel.

DISCLAIMER: The materials provided on this web site are for informational purposes only and not for the purpose of providing legal advice. You should contact an attorney to obtain legal advice about any particular issue or problem. The materials do not represent the opinions or conclusions of individual members of the Task Force. The posting of these materials does not create requirements or mandates.