
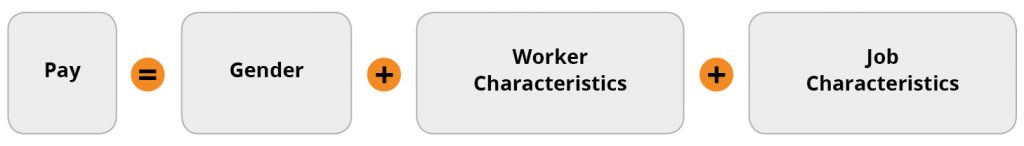
Measuring Pay Equity: Large Sample Size Individual Analysis
Individual-level analyses in pay equity investigations have two goals:
- identify individuals who may be negatively impacted by potential pay disparities,
- estimate the amount by which they may be negatively impacted.
When the number of employees included in the analysis is sufficiently large (e.g., the 30/5-rule criteria are met for regression analysis) individual-level analysis builds upon the results of the group-level analyses (include link to description of the “group_large” analysis) via the following steps:
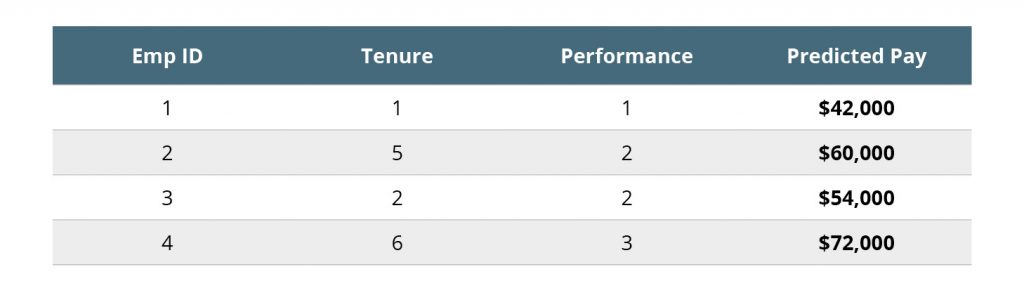
Step 1: Estimate Predicted Pay for Individual Employees
The group-level regression analysis provides a model that can be used to estimate the pay for each individual. This value will be the pay “predicted” by the model, given the characteristics of each individual employee. To estimate predicted pay for each employee, the group-level regression model is used but excludes any group indicator variables, (e.g., gender).
1. Regression Model for Pay Equity
2. Regression Model for Pay Prediction

To estimate predicted pay for each employee, apply the estimated regression parameters to each employee’s value of explanatory variables. A very simplified hypothetical example illustrates this process:
Regression model:
Predicted Pay = 30,000 Base Salary + 2,000 x Tenure + 10,000 x Performance
For the following hypothetical sample of employees with the given levels of Tenure and Performance, predicted pay is presented in the last column:
Step 2: Compute the Estimated Pay Differences for each Individual
The estimated pay difference for each employee is calculated as the difference between the employee’s actual pay and their predicted pay estimated in Step 1. For the hypothetical sample of employees:
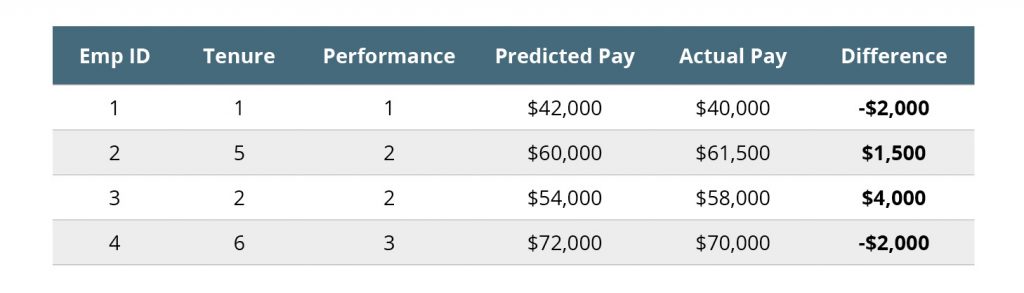
Employees whose actual pay is below their predicted pay may be underpaid—their actual earnings are below what the model suggests as predicted pay. Employees whose actual pay is higher than their predicted pay may be overpaid.
Estimated individual pay information must be interpreted thoughtfully. For example, they should be considered in relation to average salary levels: a pay difference of $5,000 among employees with an average salary is $30,000 per year accounts for a 17% disparity; whereas a gap of $5,000 among employees with an average salary of $150,000 is only a 3% difference. Rather than interpreting individual pay differences in raw dollar-value, experts often convert them into statistical metrics (standard deviation (SD) units) through a procedure referred to as standardization1. Since an SD≥1.96 is considered statistically significant, it is possible to use this criterion to identify individuals who can be considered seriously below their predicted (expected) pay. Individuals with larger SD’s indicate greater severity in their pay gap.
Next Step
Once the pay differences for individual employees are computed and the potentially underpaid employees are identified, the next step is to investigate the cause of that difference using methods such as those described in the section on “cohort analysis.”
Footnote
- Standardizing data is transforming raw data into z-score units which many refer to as standard deviation units.

DISCLAIMER: The materials provided on this web site are for informational purposes only and not for the purpose of providing legal advice. You should contact an attorney to obtain legal advice about any particular issue or problem. The materials do not represent the opinions or conclusions of individual members of the Task Force. The posting of these materials does not create requirements or mandates.